Here’s a quick start guide to taking and interpreting 10046 trace, with bind variables.
1. Generate the trace
SQL> ALTER SESSION SET tracefile_identifier='MYTRACE';
SQL> ALTER SESSION SET EVENTS '10046 trace name context forever, level 8';
SQL> --alternately,
SQL> --ALTER SESSION SET sql_trace=true;
SQL> var bpno NUMBER
SQL> EXEC :bpno := 92000;
SQL> DELETE FROM batch_process WHERE process_id = :bpno;
SQL> ALTER SESSION SET EVENTS '10046 trace name context off';
SQL> --alternately,
SQL> --alter session set sql_trace= false;
2. Find the trace
Go to diagnostic dest on the db server (the default is $ORACLE_BASE/diag/rdbms/
cd to trace directory, look for *MYTRACE*.trc
eg
[oracle@C102 trace]$ ls *MYTRACE*
C102_ora_19385_MYTRACE.trc  C102_ora_19385_MYTRACE.trm
The .trc file (in this case C102_ora_19385_MYTRACE.trc) will have the 10046 output in it.
3. Interpret the trace
There are 2 ways to interpret it:
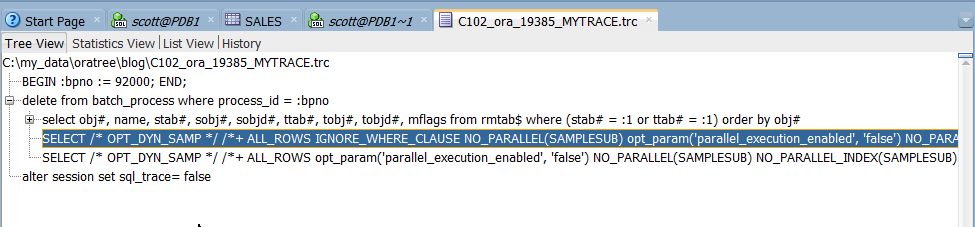
1) open the file in SQL developer, which automatically analyses it for you
2) use tkprof on it
[oracle@C102 trace]$ tkprof C102_ora_19385_MYTRACE.trc C102_ora_19385_MYTRACE.out explain=scott/passwd
...
SQL ID: 3pfvf0sq4vhx2 Plan Hash: 3613227910

delete from batch_process
where
 process_id = :bpno


call     count       cpu    elapsed       disk      query    current        rows
------- ------  -------- ---------- ---------- ---------- ----------  ----------
Parse        1      0.00       0.00          0          0          0           0
Execute      1      0.00       0.00          0          5          0           0
Fetch        0      0.00       0.00          0          0          0           0
------- ------  -------- ---------- ---------- ---------- ----------  ----------
total        2      0.00       0.00          0          5          0           0

Misses in library cache during parse: 1
Misses in library cache during execute: 1
Optimizer mode: ALL_ROWS
Parsing user id: 109  (SCOTT)
Number of plan statistics captured: 1

Rows (1st) Rows (avg) Rows (max)  Row Source Operation
---------- ---------- ----------  ---------------------------------------------------
         0          0          0  DELETE  BATCH_PROCESS (cr=3 pr=0 pw=0 time=32 us)
         0          0          0   INDEX RANGE SCAN BATCH_PROCESS_IND1 (cr=3 pr=0 pw=0 time=10 us cost=2 size=39 card=1)(object id 92766)


Rows     Execution Plan
-------  ---------------------------------------------------
      0  DELETE STATEMENT   MODE: ALL_ROWS
      0   DELETE OF 'BATCH_PROCESS'
      0    INDEX   MODE: ANALYZED (RANGE SCAN) OF 'BATCH_PROCESS_IND1'
               (INDEX)

********************************************************************************
...